Gallium PCM Melting: Tracking a Moving Melt Front and Making the Energy Books Balance
“Before we commit to a phase-change thermal buffer, can your solver track a solid-liquid melt front with natural convection — and prove the energy going in actually shows up as melted material?”

The ask
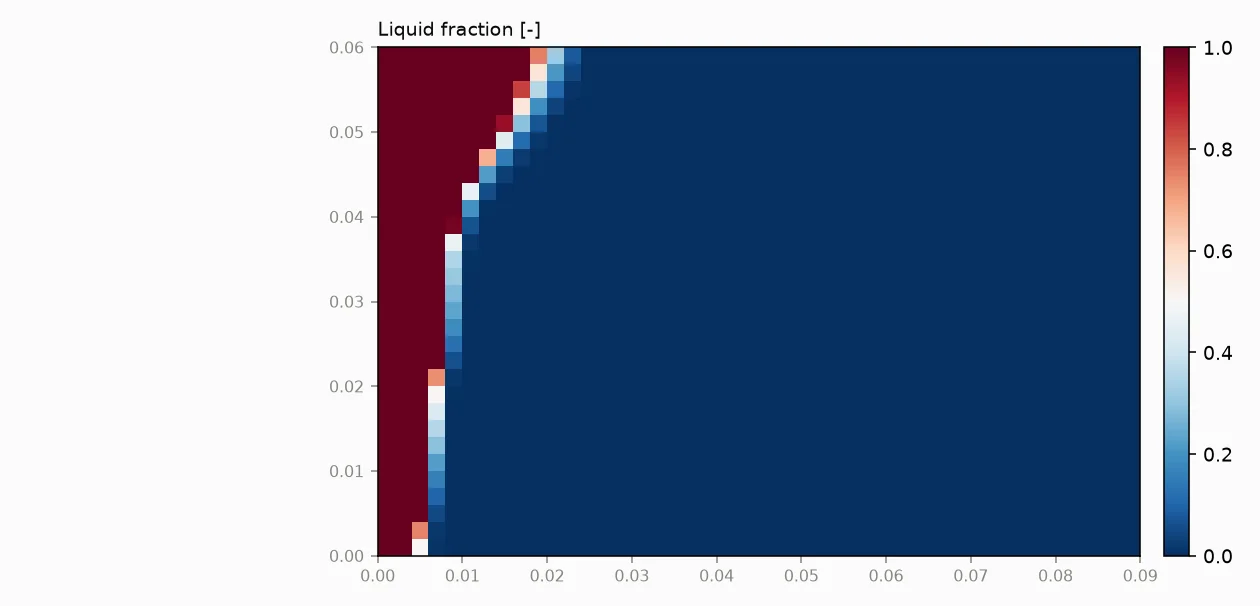
The classic gallium melting benchmark: a 9 x 6 cm cavity of solid gallium held at 28.3 C, with the left wall stepped to 38.0 C — 8.2 K above the liquidus. Gallium is the standard liquid-metal test for phase-change solvers because the observables that matter are unforgiving: the position and shape of the melt front, and the buoyancy-driven convection cell that tilts it. The job was to run the transient melt with the enthalpy-porosity method (apparent heat capacity plus a Carman-Kozeny mushy zone) and let the pipeline's own QA checks decide whether the physics holds together.
What the pipeline ran
Smidr's structured finite-volume solver on a 45 x 30 x 1 grid (1,350 cells, quasi-2D): incompressible projection on a staggered grid, first-order upwind transport, Boussinesq buoyancy, enthalpy-porosity phase change, laminar. The run advanced 6,000 adaptive time steps covering 76.3 s of melting, with the time step ending at 12.7 ms. Total wall time: 2.9 seconds, including QA checks and report generation.
The verdict
- All four automated QA checks passed: stability (solution remained finite), incompressibility (max post-projection divergence 1.44e-15 1/s), energy balance (0.2% imbalance), melt margin (melt fraction 11.3%)
Key numbers
| Metric | Value | Note |
|---|---|---|
| Verdict | GO | All four automated QA checks passed; no human in the loop |
| Melt fraction at 76.3 s | 11.3% | Liquid fraction integrated over the cavity; melting still in progress by design |
| Energy balance closure | 0.2% | Boundary heat rejection (-23.9 W) vs energy storage (+24.0 W); the melted mass is accounted for |
| Max post-projection divergence | 1.44e-15 1/s | Incompressibility enforced to machine precision |
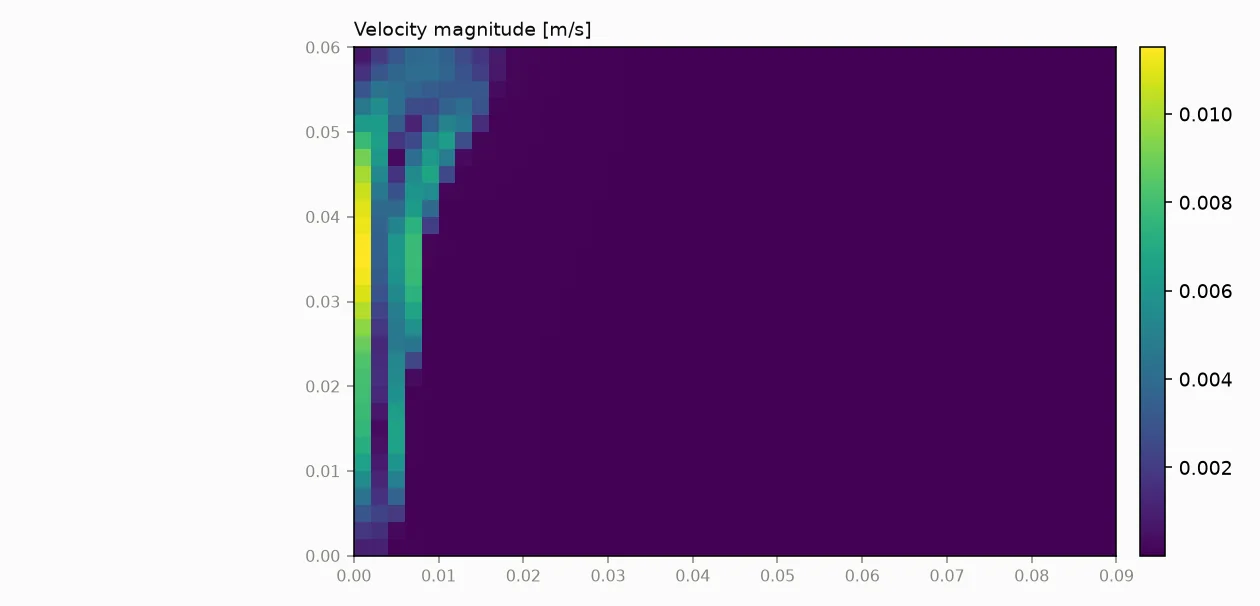
| Peak melt velocity | 11.5 mm/s | Buoyancy-driven convection cell rising along the hot wall |
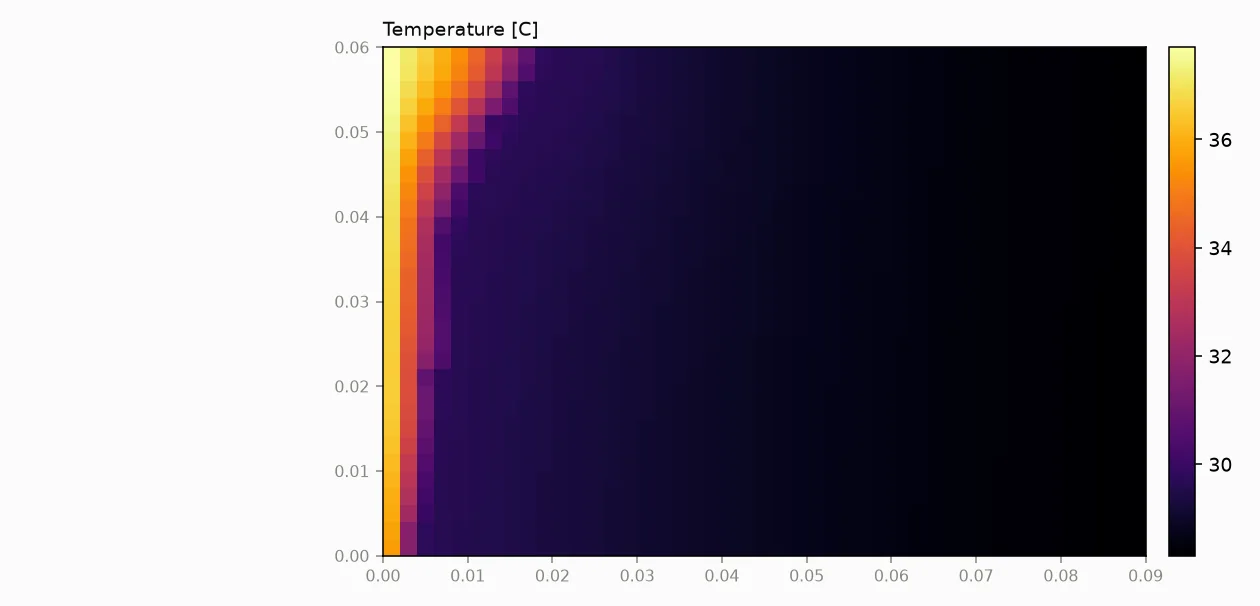
| Hot-wall superheat | 8.2 K above liquidus | 311.15 K wall against a 302.98 K liquidus |
| Grid | 45 x 30 x 1 (1,350 cells) | Quasi-2D 9 x 6 cm cavity, benchmark resolution |
| Simulated time | 76.3 s (6,000 steps) | Adaptive time stepping, final dt 12.7 ms |
| Wall time | 2.9 s | Full transient including QA checks and report |
Quality, stated plainly
The run's QA gate checked four things and passed all four: the solution stayed finite, post-projection divergence sat at machine precision (1.44e-15 1/s), the energy books closed to 0.2% (heat leaving through the walls matched the energy stored in warming and melting the gallium), and the melt fraction cleared its margin at 11.3%. The physics signature is visible in the field render: the melt front is tilted — wider at the top of the cavity than the bottom — which is exactly what the rising convection cell should do, and is the classic qualitative observable this benchmark exists to test. The report is equally clear about what this run is not: screening fidelity with diffusive first-order upwind transport (trust the integral quantities — melt fraction, heat splits, temperatures — over fine flow structure), no mesh-refinement study in this run, steady state not reached because melting was still under way when the clock stopped, and the report itself recommends a film-coefficient sensitivity sweep before any hard sign-off. Those caveats are printed in the deliverable, not buried.
Figures from the run
Why this matters
Phase-change thermal design — PCM heat buffers, melt processing, thermal batteries — lives or dies on two questions: where is the melt front, and did the energy actually go where the solver says it did. Most CFD reports hand you a pretty temperature plot and ask you to trust it. This run hands you a closed energy budget (0.2%), a divergence-free velocity field to machine precision, and a melt front whose convection-driven tilt matches the known behavior of the hardest standard benchmark in the category — with the solver's fidelity limits stated in the same report as the verdict. If a screening run fails these checks, you get a NO-GO, not a prettier plot. That is what makes a 3-second transient useful to an engineering manager: it is fast enough to sweep, and honest enough to trust.
- Screening fidelity: first-order upwind transport is diffusive — trust integral quantities (melt fraction, heat splits, component temperatures) over fine flow structure.
- Laminar model, no turbulence closure.
- Quasi-2D grid (45 x 30 x 1, 1,350 cells) at benchmark resolution; no mesh-refinement study in this run.
- Transient snapshot at 76.3 s with 11.3% melted — steady state not reached, by the nature of the problem.
- Film coefficients are model inputs; the report recommends a sensitivity sweep before hard sign-off.
Your part. Your question. Same rigor.
Send us the geometry and the question — get the analysis, the honest error bars, and a verdict you can defend.
Request pilot access